Transforming Asset Visibility Across Manufacturing & Warehouse Operations

A large manufacturing organization managing 10,000+ assets validated BLE AoA RTLS to track assets in real time, locate specific assets faster, understand movement history, analyze dwell time, and improve visibility across production and warehouse environments.

Transforming Asset Visibility Across

The Cost of Poor Asset Visibility

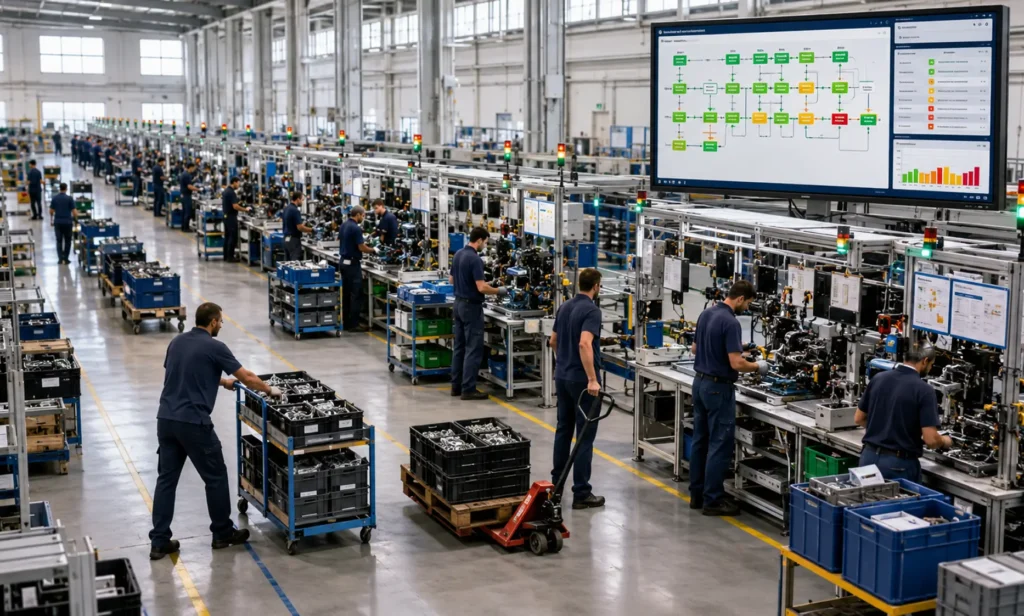
Large manufacturing environments often manage thousands of physical assets across production, testing, warehouse, storage, and operational zones. Without real-time visibility, teams depend on manual search, operator knowledge, and fragmented records to locate assets and understand movement. The case study highlights the need to move beyond conventional asset management and create a reliable digital visibility layer across the facility.

Asset Search Delays

Teams spend time locating specific assets across large production and warehouse areas.

Limited Real-Time Visibility

Users lack a live view of where assets are currently located.

No Movement History

 Asset movement across zones is difficult to trace manually.

Idle Asset Blind Spots

Assets that remain idle or stationary for long periods are hard to identify.

Fragmented Production & Warehouse Visibility

Production and warehouse visibility remains disconnected without a centralized system.

Manual Verification Effort

Employees must physically search, ask operators, and check multiple areas to verify asset location.

How Asset Visibility Works

1.

Asset

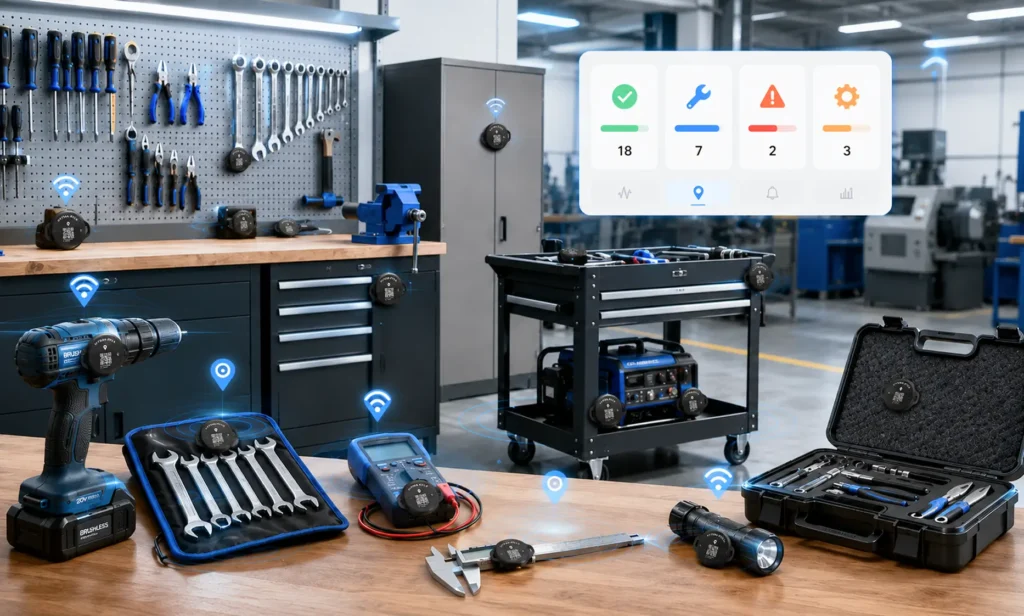
Physical assets are selected for tracking across production, warehouse, storage, and operational zones.

Asset

2.

BLE Tag

A BLE asset tag is attached to each selected asset, creating a digital identity for that physical item.

BLE Tag

3.

BLE AoA Anchors

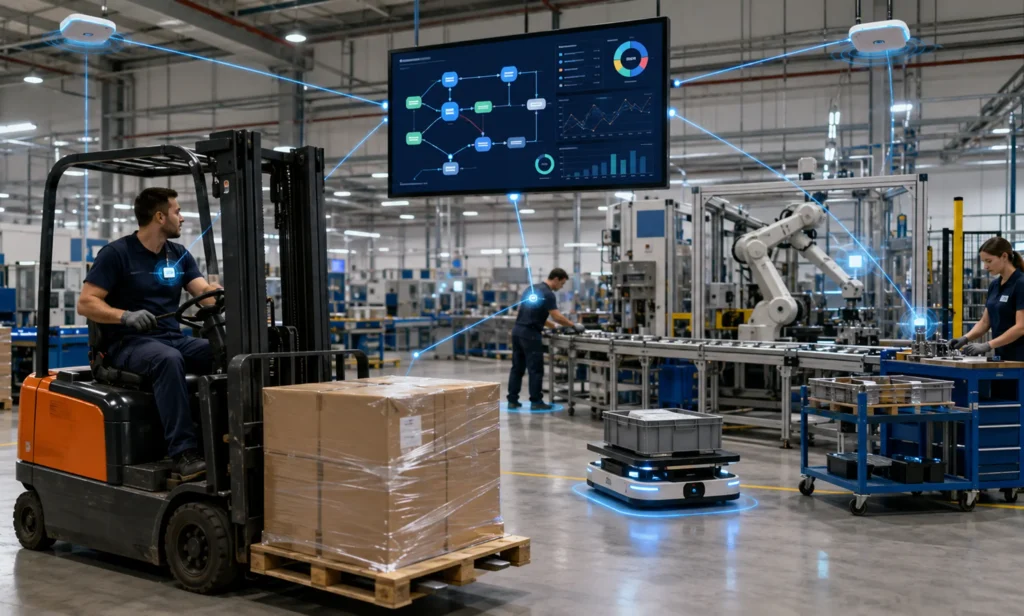
Strategically positioned BLE AoA anchors capture signals from tagged assets and support location estimation across the facility.

BLE AoA Anchors

4.

RTLS Platform

The location data is processed and presented through the RTLS platform, creating a digital representation of the physical environment.

RTLS Platform

5.

Visualization & Analytics Dashboard

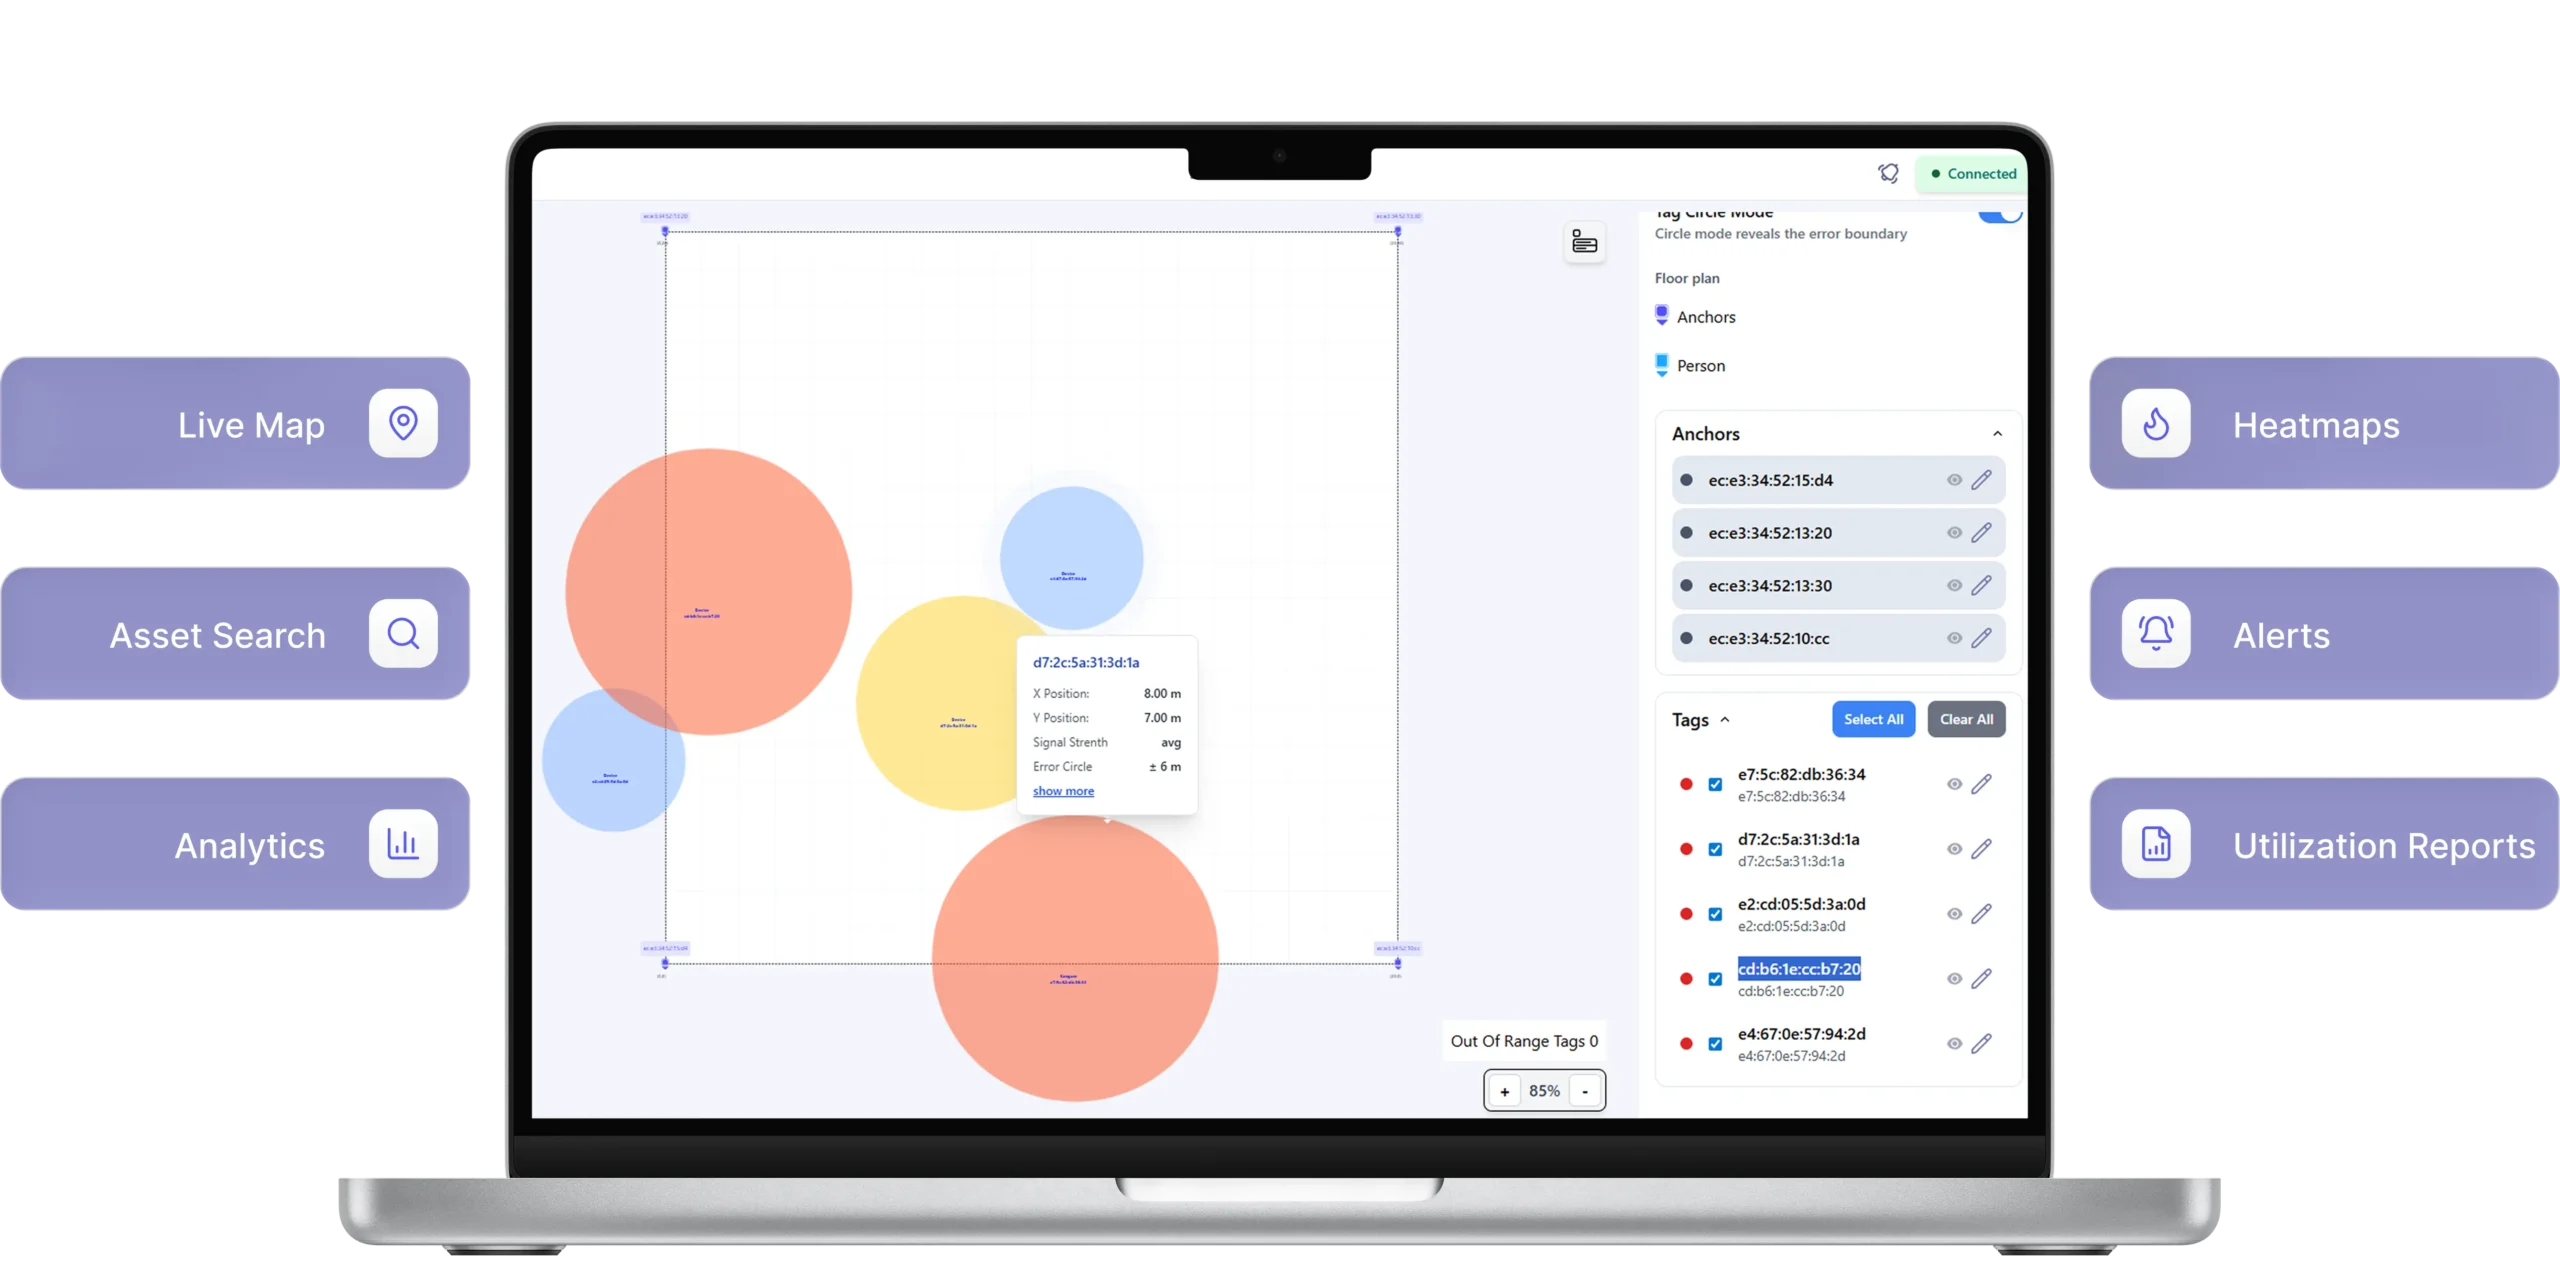
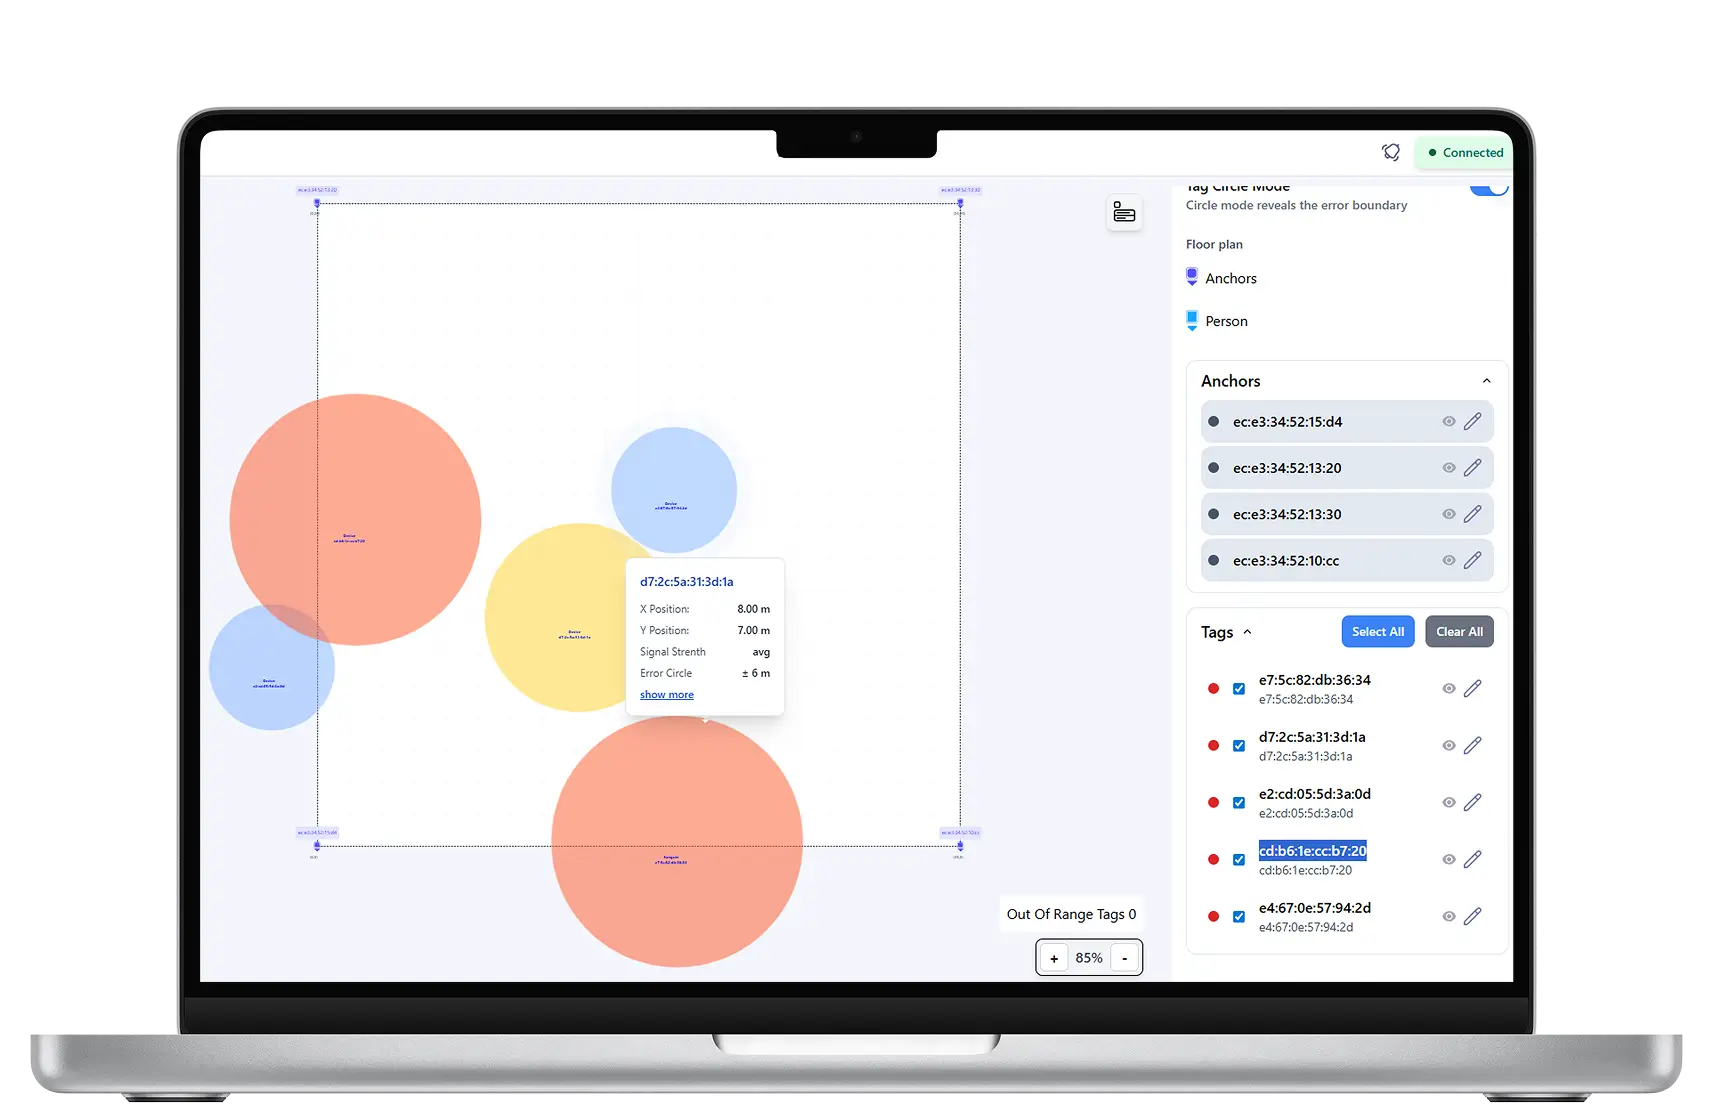
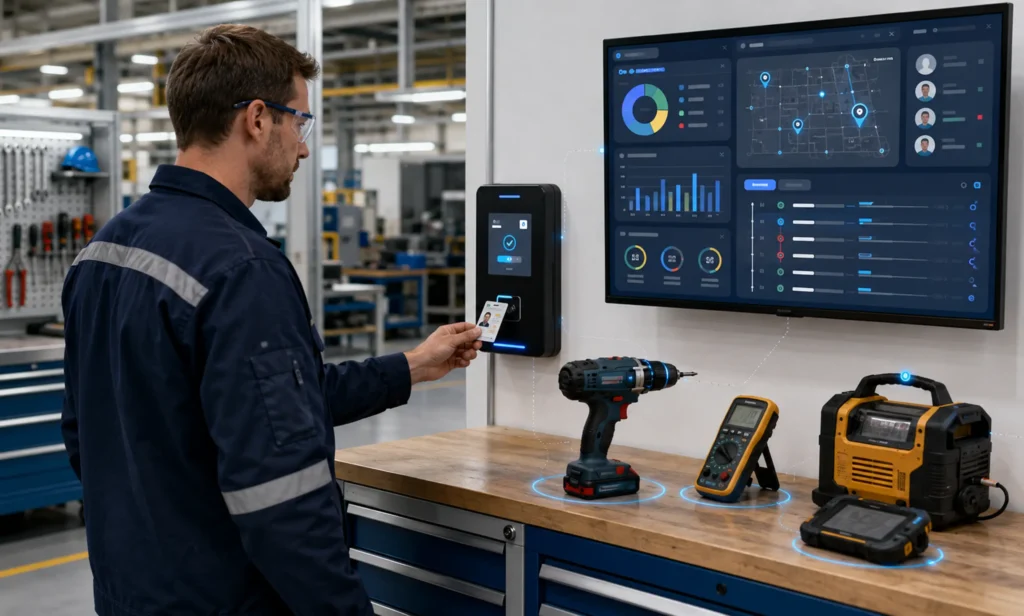
Users can view asset locations, search for assets, monitor zones, review movement history, analyze dwell time, and generate operational insights.

Visualization & Analytics Dashboard

Key Features

Real-Time Asset Tracking

Search & Locate

Digital Facility Visibility

Geofencing

Dwell-Time Analytics

Historical Movement

Movement Playback

Heatmap Analytics

Tag & Battery Monitoring

Business Impact of Asset Visibility

Challenge Benefit
Manual asset search ✓ Faster digital Search & Locatey
Limited real-time visibility ✓ Live asset visibility
No movement traceability ✓ Complete movement history
Idle assets hard to identify ✓ Dwell-time analytics
Physical zone monitoringy ✓ Digital geofencing
Sustainability reporting ✓ Improved ESG performance

Technologies

BLE AoA

Angle-based indoor positioning for real-time asset visibility

BLE Asset Tags

Digital identity for selected physical assets

BLE AoA Anchors

Infrastructure for capturing tag signals

RTLS Location Engine

Location estimation and processing layer

RTLS Platform

Centralized visualization, analytics, event monitoring, and reporting

Asset Visibility Dashboard

DashboardShowcase
Asset Tracking Dashboard-mobile
Asset Tracking Group

Success Metrics

Reduced Asset Search Time

Improved Asset Utilization

Better Operational Visibility

Real-Time Asset Intelligence

Results may vary depending on deployment scope, facility layout, asset type, tag placement, RF environment, and operational conditions.

Asset Visibility Across Industries

FAQs

The PoC evaluated whether BLE AoA based RTLS could provide reliable asset visibility in real manufacturing conditions across production and warehouse environments.

The solution was tested in production and warehouse environments, including areas with active equipment, testers, racks, shelves, storage zones, and enclosed containers.

The PoC demonstrated real-time location tracking, Search & Locate, geofencing, dwell-time analytics, historical movement, movement playback, heatmaps, event reporting, tag monitoring, and tracking in complex asset-placement scenarios.

Dwell-time analytics shows how long assets remain in different zones, helping identify idle assets, waiting periods, and possible process bottlenecks.

Yes. The case study describes a roadmap for expanding from selected critical assets and zones to additional production areas, warehouse areas, asset categories, multiple facility zones, and enterprise-scale visibility.

Ready to Optimize Equipment Energy Consumption?